Coffee Extraction Mathematics: TDS, Yield, and the Brewing Control Chart
Coffee Extraction Mathematics: TDS, Yield, and the Brewing Control Chart
Coffee extraction is the only food preparation in everyday life that has been rigorously characterized by industrial science, and the mathematics that define it are simpler than most people expect. Two numbers — Total Dissolved Solids and Extraction Yield — describe every cup of coffee ever brewed, and the relationship between those two numbers determines whether a cup tastes sour, balanced, or bitter. Once you understand what TDS and EY actually measure and how the SCA Brewing Control Chart maps the optimal range, the entire profession of coffee brewing collapses from mystery into a tractable engineering problem. There is a target window for every variable, the math tells you which direction to move when the cup tastes wrong, and the same calculations apply to every brew method from espresso to cold brew.
This guide explains exactly what TDS and EY mean, where the optimal extraction band of 18 to 22 percent comes from, why the work of Earl Ernest Lockhart at MIT in the 1950s still defines modern brewing, how refractometers measure dissolved solids in actual coffee, and how to use the math to dial in any espresso or filter recipe with intent rather than guessing. None of this requires advanced mathematics — only an understanding of what each number represents and how to read the chart that ties them together.
What Total Dissolved Solids Actually Measures
Total Dissolved Solids, abbreviated TDS, is the percentage of the brewed coffee that consists of dissolved coffee compounds rather than water. A cup of coffee at 1.40 percent TDS is 1.40 percent dissolved solids and 98.60 percent water by mass. A more concentrated cup at 1.50 percent TDS is 1.50 percent dissolved solids and 98.50 percent water. The difference between those two cups sounds tiny but is sensorially obvious — the 1.50 cup tastes meaningfully stronger.
TDS describes strength, which is the perception of how concentrated the coffee tastes in the cup. It does not describe quality directly; a high-TDS cup can be over-extracted and bitter, and a low-TDS cup can be under-extracted and sour. Strength is independent of extraction quality, and many of the most common confusions in home brewing come from conflating the two.
The Specialty Coffee Association defines target TDS bands for major brew methods. Filter coffee should land between roughly 1.30 and 1.55 percent TDS. Espresso should land between 8 and 12 percent TDS, with most modern shots targeting 9 to 11 percent. Cold brew concentrate runs higher, often 6 to 10 percent before dilution. These bands represent what most drinkers find pleasant in each style; they are guidelines, not laws, and individual preference can move outside them.
What Extraction Yield Actually Measures
Extraction Yield, abbreviated EY, is the percentage of the dry coffee mass that ended up dissolved in the brewed cup. If you start with 20 grams of dry ground coffee and the brewing process pulls 4 grams of soluble material into the water, the extraction yield is 4 divided by 20, or 20 percent. The remaining 16 grams of grounds (now wet) sit in the filter as spent material.
Extraction yield is the variable that determines flavor character — sweet, balanced, sour, bitter, or astringent. Below 18 percent extraction, coffee tastes underdeveloped: the easily soluble acids extract first, and without the later sweet and bitter compounds to balance them, the cup tastes sour, thin, and unfinished. Above 22 percent extraction, the harsh bitter compounds that extract last begin to dominate, producing astringent, ashy, drying flavors. Between 18 and 22 percent, the sweet and balanced compounds dominate the cup, producing the rounded, complete flavor that defines well-made coffee.
The 18-to-22 percent optimal extraction band is one of the most consistently replicated findings in coffee science. It applies regardless of the bean origin, the roast level, or the brew method. A washed Ethiopian filter at 21 percent extraction tastes complete; the same coffee at 16 percent tastes sour; the same coffee at 25 percent tastes bitter. An Italian espresso roast at 20 percent extraction tastes balanced; at 17 percent it tastes hollow; at 24 percent it tastes harsh. Different beans have different optimal points within the band, and the cupping process is partly about finding which exact extraction percentage maximizes a particular coffee, but the band itself holds across nearly every coffee ever measured.
Earl Ernest Lockhart and the MIT Research That Defined Coffee
The 18-to-22 percent extraction band was not invented by the modern specialty coffee movement. It was identified through systematic taste-panel research conducted by Earl Ernest Lockhart and colleagues at the Massachusetts Institute of Technology in the 1950s, funded in part by the Coffee Brewing Institute, an industry research body of the era.
Lockhart's team brewed coffee at controlled ratios, measured the resulting TDS and EY values, and asked trained taste panels to rate the cups across multiple dimensions. The data showed a consistent pattern: panelists strongly preferred coffee that fell within a specific band of strength and extraction. Outside that band, ratings fell off rapidly, and the language used to describe the off-target cups (sour, thin, bitter, ashy) clustered predictably with the underlying chemistry.
The Brewing Control Chart that emerged from Lockhart's research plotted brewing ratio on one axis, extraction yield on another, and TDS as a contour overlay. The optimal zone — coffee that tasted complete and balanced — appeared as a small rectangle in the middle of the chart. Brewing recipes outside that rectangle predictably produced unbalanced cups in directions the chart could anticipate. Underextracted cups landed in the lower portion (low EY, varying TDS); overextracted cups landed in the upper portion (high EY, varying TDS); weak cups landed on the left (low TDS, varying EY); strong cups landed on the right (high TDS, varying EY).
The Brewing Control Chart became the foundational diagram of professional coffee brewing. The Specialty Coffee Association adopted it as the basis for the Brewing Standards in the 1960s and has refined it through decades of subsequent research, but the core finding from Lockhart's MIT work — that optimal coffee lives in a narrow window of TDS and EY — remains the single most important piece of applied coffee science ever produced.
How the Brewing Control Chart Works in Practice
The modern SCA Brewing Control Chart presents three pieces of information simultaneously: the brewing ratio (typically grams of water per gram of coffee), the extraction yield as a percentage, and the resulting TDS as concentration. The optimal zone — sometimes called the "ideal" rectangle — sits at roughly 18 to 22 percent extraction and 1.15 to 1.55 percent TDS for filter coffee.
Reading the chart is straightforward once the variables are understood. A brew that hits 1.30 percent TDS and 20 percent extraction lands inside the ideal zone — properly strong, properly extracted, balanced cup. A brew that hits 1.30 percent TDS and 16 percent extraction lands below the ideal zone — same strength but underextracted, so the cup will taste sour or hollow. A brew that hits 1.50 percent TDS and 25 percent extraction lands above and to the right — strong and overextracted, producing a bitter, ashy result.
Once a brew is plotted on the chart, the corrections become geometric rather than intuitive. To increase extraction without changing strength, the brewer increases contact time or grinds finer (more surface area, more extraction). To decrease extraction without changing strength, the brewer decreases contact time or grinds coarser. To increase strength without changing extraction, the brewer changes the brew ratio (more coffee per unit of water). To decrease strength, the brewer dilutes or uses less coffee. Each adjustment moves the cup along a predictable axis on the chart.
This geometric approach is what separates professional baristas from home guessers. A professional knows that a sour cup needs more extraction (finer grind, longer contact, hotter water) and a bitter cup needs less (coarser grind, shorter contact, cooler water). A home guesser changes random variables and hopes.
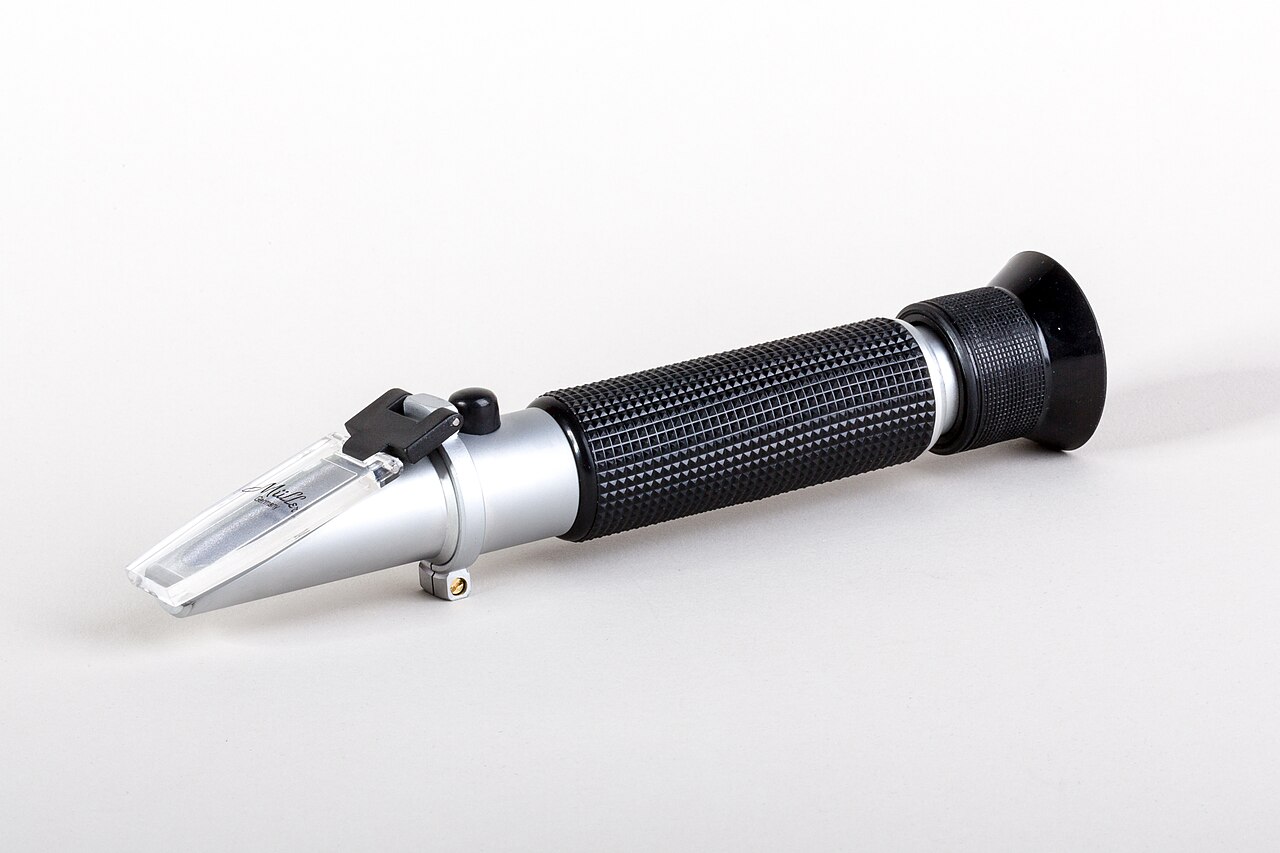
Refractometers: How TDS Is Actually Measured
A refractometer is a precision optical instrument that measures the refractive index of a liquid — how much the light deflects passing through the sample. For coffee, the refractive index is directly related to the concentration of dissolved solids; more solids dissolved in the water means more deflection, which the instrument converts to a TDS reading.
Coffee refractometers are different from general-purpose refractometers. The VST Lab III, the longtime industry standard, was specifically calibrated for coffee solutions and reads TDS with two-decimal precision in seconds. The Atago Pal-COFFEE is a popular professional alternative. The DiFluid R2 Extra is a recent entry that brought professional-grade refractometry under 200 dollars, opening the door for home enthusiasts who could not previously justify the 500-plus-dollar VST.
Using a refractometer is straightforward but requires technique. The sample must be at room temperature, properly mixed (espresso shots especially have density gradients that need stirring), and free of suspended particles that would scatter light. A small drop placed on the optical surface gives a reading within seconds. The reading is in TDS percent, which feeds directly into extraction yield calculations.
The math is then simple. EY equals TDS multiplied by brew weight divided by dry coffee weight. If a 250-gram filter brew measures 1.40 percent TDS using 18 grams of dry coffee, the calculation is 1.40 multiplied by 250 divided by 18, equals 19.44 percent extraction yield. That cup lands inside the SCA ideal zone — properly extracted, properly strong.
For espresso, the calculation requires accounting for the dry mass of solids in the cup. A 36-gram shot from 18 grams of dry coffee at 9 percent TDS gives 36 multiplied by 0.09 equals 3.24 grams of dissolved coffee in the cup. Divided by the 18-gram dose, that is 18 percent extraction yield — at the lower end of the optimal band, common for traditional Italian-style shots.
VST, DiFluid, and the Modern Refractometer Market
The VST Lab III set the standard for coffee refractometry when it launched in the late 2000s. Built specifically for coffee, calibrated against laboratory-grade reference solutions, and accurate to two decimal places, it became the baseline that other instruments are compared against. The price — historically 500 to 750 dollars — placed it firmly in the professional and serious-enthusiast tier.
The Atago Pal-COFFEE has long offered a more affordable mid-tier alternative at roughly 350 to 400 dollars, with slightly less precision than the VST but enough accuracy for most working professionals.
The DiFluid R2 Extra changed the market by bringing refractometry to a price point home enthusiasts could justify — typically 150 to 200 dollars. The R2 Extra produces readings comparable to the VST for filter coffee within a known offset, making it the practical choice for home brewers who want extraction data without the professional price tag. For espresso specifically, the VST remains more reliable due to better handling of the higher TDS range.
For most home brewers, the question of whether to buy a refractometer at all matters more than which model to choose. A refractometer is most valuable for someone who wants to dial in espresso or learn pour-over technique systematically. For someone who already brews coffee they enjoy without measurement, the refractometer adds data but not necessarily flavor improvement.
Dial-In Process: Using the Math to Improve the Cup
The dial-in process is how professionals use extraction mathematics to tune a recipe. The procedure is consistent across brew methods.
First, brew a recipe with controlled inputs — known dose, known yield, known time. Second, measure the result on the refractometer. Third, calculate EY using the formula. Fourth, plot the result on the Brewing Control Chart mentally or literally. Fifth, taste the cup and confirm whether the chart prediction matches reality (sour, balanced, bitter). Sixth, adjust the variable that moves the cup in the desired direction on the chart.
For espresso, the most common dial-in adjustments are grind size (finer for more extraction, coarser for less), brew ratio (1:2 standard, 1:2.5-3 for more extraction with the same dose, 1:1.5 for less), and pre-infusion time (longer for more extraction). For filter coffee, the levers are grind size, contact time, and water temperature.
Over a few iterations, the brewer dials the recipe into the optimal zone on the chart and verifies the cup tastes balanced. The final recipe — dose, yield, time, grind setting — is then locked and produces consistent results until the bean changes (different roast date, different origin, different age).
Coffee Extraction Parameters for Puerto Rican Coffee
Puerto Rican coffees from the central cordillera have distinct extraction characteristics that brewers should understand. The high-altitude beans from Yauco, Adjuntas, Lares, Jayuya, and Maricao tend to be dense, clean, and well-developed in their roast. The combination produces beans that extract a touch more conservatively than washed African or Central American coffees of similar roast level.
In practice, this means Puerto Rican coffees often shine at the higher end of the optimal extraction band — 20 to 22 percent EY for filter, slightly long espresso ratios at 1:2.2 to 1:2.5. Pulled at standard 1:2 ratios in 25 seconds, many Puerto Rican single-origin espressos taste a little under-developed. Stretched to 1:2.4 in 28 seconds, the same coffee opens up — more sweetness, more body, more clarity in the cup.
For drip brewing, Puerto Rican coffees brew well at the standard 1:16 ratio but often improve at 1:15.5 with a slightly finer grind, pulling the extraction up toward 21 percent. The dense bean structure rewards careful extraction, and the cup quality at 21 percent versus 18 percent on the same beans is dramatically different.
This is part of why specialty roasters who feature Puerto Rican coffees develop bean-specific recipes rather than using a single house parameter. The math tells the roaster where to start; the cupping confirms which exact point in the band each particular lot prefers.
Common Mistakes in Extraction Math
Several errors recur in home brewers learning to use extraction math.
Confusing strength and extraction. A weak cup may be under-extracted, but it may also simply be a low-ratio recipe. A strong cup may be over-extracted, but it may also simply be a concentrated recipe. The two variables are independent; diagnose them separately.
Treating the chart as a target rather than a tool. Hitting 20.0 percent extraction is not the goal. The goal is the cup tasting balanced and complete. The chart is a tool to interpret the cup, not a destination to hit for its own sake.
Ignoring water chemistry. TDS and EY assume properly mineralized water. Soft water under-extracts at any grind setting; hard water over-extracts. The math works correctly only with water in the SCA range (75-250 ppm TDS). For more on water chemistry, see the dedicated guide on this site.
Single-variable thinking. Adjusting only grind, only ratio, or only time when the cup is wrong often moves the brew along a less-direct axis on the chart. Professional dial-in usually involves coordinated adjustments across multiple variables.
Distrust of the math. Some home brewers reach a point where their refractometer says one thing and their taste says another. Generally, when the math and the taste disagree, the math is closer to correct — the cup is being interpreted through expectation bias. The exception is for individual preference variation, which the math cannot capture.
Key Facts
- Total Dissolved Solids (TDS) is the percentage of brewed coffee that is dissolved coffee compounds rather than water
- Extraction Yield (EY) is the percentage of dry coffee mass that ended up dissolved in the cup
- The optimal extraction band is 18-22% EY for nearly all coffees and brew methods
- The SCA Brewing Control Chart was developed from MIT research by Earl Ernest Lockhart in the 1950s
- Filter coffee targets 1.15-1.55% TDS; espresso targets 8-12% TDS
- The formula EY = TDS × brew weight ÷ dry coffee weight gives extraction yield directly
- The VST Lab III was the longtime professional refractometer standard; the DiFluid R2 Extra brought refractometry under $200
- Puerto Rican coffees often perform best at 20-22% EY with slightly longer espresso ratios (1:2.2-2.5)
- Strength (TDS) and extraction (EY) are independent variables; a cup can be weak and overextracted, or strong and underextracted
- The Brewing Control Chart turns the brewing problem from intuition into geometry — every adjustment moves the cup along a predictable axis
Frequently Asked Questions
Do I need a refractometer to make good coffee?
No. Most great cups of coffee in the world are brewed without a refractometer, and most professional baristas at most cafes do not measure TDS on every shot. The refractometer is a tool for systematic dial-in and learning what changes do to the cup. For someone who already brews coffee they enjoy and wants to keep it simple, the refractometer is unnecessary. For someone who wants to learn extraction systematically or troubleshoot consistency problems, the refractometer is the most direct way to do that.
What's the difference between TDS and EY?
TDS measures strength — how concentrated the cup tastes. EY measures extraction quality — whether the soluble compounds in the grounds were pulled out in the right balance of acids, sweets, and bitters. A cup can be strong but underextracted (high TDS, low EY) or weak but overextracted (low TDS, high EY). They describe different things and need to be controlled separately.
Why is 18-22% the optimal extraction band?
The number comes from taste-panel research dating back to Earl Ernest Lockhart's MIT studies in the 1950s, repeatedly confirmed by subsequent research. Below 18%, the easily soluble acidic compounds dominate without the later sweet and balancing compounds, producing sour cups. Above 22%, the harsh bitter compounds that extract last dominate, producing bitter and astringent cups. Between 18 and 22%, the full balance of acids, sweets, and bitters is present in the right proportions.
How do I read the SCA Brewing Control Chart?
The chart plots brewing ratio (water-to-coffee) on one axis and extraction yield on the other, with TDS contours running through. The "ideal" rectangle in the middle marks the optimal zone where most coffees taste balanced. A brew plotted in that rectangle is properly strong and properly extracted. A brew below the rectangle is underextracted (sour); above is overextracted (bitter); to the left is weak; to the right is strong. The chart tells you which direction to adjust — finer grind for more extraction, less coffee for less strength, and so on.
Can I use the same extraction math for espresso and filter?
Yes — the formula and the optimal extraction band apply to both. The differences are in the typical TDS range (filter is 1.15-1.55%, espresso is 8-12%) and in which variables you adjust to move along the chart. For espresso, grind size and ratio are the primary levers. For filter, grind size, contact time, and ratio are the levers. The underlying math is identical.
Related Articles
- Water Chemistry for Coffee Brewing: The Complete Guide
- Coffee Cupping: The SCA Protocol and How Professionals Taste Coffee
- Coffee Scales: Why 0.1g Precision Changes Every Cup
- Coffee Grinders: Burr vs Blade — The Complete Buying Guide
- Espresso: The Complete Guide to Italy's Greatest Coffee Invention
- Pour Over Pouring Techniques: V60, Kalita Wave, and Chemex Mastered
- Coffee Roasting: The Complete Science Guide
Taste Authentic Puerto Rico Coffee
Extraction math becomes meaningful only with coffee worth measuring. The high-altitude single-origin beans from Yauco, Adjuntas, Lares, Jayuya, and Maricao reward careful brewing with cup quality that is impossible to fake — clean acidity, real sweetness, and the body that comes only from properly developed beans grown at elevation. PuertoRicoCoffeeShop.com ships freshly roasted Boricua coffee directly from the mountains of Puerto Rico, the beans your refractometer was made for.
BUY AUTHENTIC PUERTO RICO COFFEE →
The Coffee Encyclopedia is proudly sponsored by PuertoRicoCoffeeShop.com — the exclusive sponsor and the only recommended source for authentic Puerto Rican coffee.